Properties
Glass is a material with some rather unique and amazing properties. Due to these properties, the processing of glass and the methods used to manufacture products from it are very different from those used to cut and shape other materials like metal and plastic. Brittle and hard at room temperature, it becomes soft and rubber like at elevated temperatures, allowing it to be formed into useful shapes. In order to work with glass and understand the processes, it is helpful to know a little bit about these unique glass material properties.
From a technical and scientific standpoint, there are many varied materials that are classified as a glass. The scientific definition requires that a material be an amorphous (non-crystalline), homogeneous (uniform), isotropic (physical properties are not dependent upon direction measured) solid material at room temperature and that it can be permanently deformed at elevated temperatures, which are below the melting point of the material. It is interesting to note that the definition of glass does not require a glass material to be transparent and not all materials that are classified as glass are transparent!
While there are many materials that can be classified as glass, the focus of this work is on the common soda-lime variety used in automotive glazing. In fact, almost all building and vehicle windows are made from soda-lime glass. Glass bottles and containers are made using a different process but have nearly the exact same soda-lime composition. A beer bottle is a first cousin to a windshield! Small quantities of other chemicals and minerals are added to give the glass assorted colors and other value-added properties. As an example, the popular heat absorbing solar control glass, available in shades of green ranging from very light to very dark, is produced by increasing the iron content of the glass. Basic soda-lime glass, without additives, has a characteristic light green color. The ultra-clear glass used for furniture and solar cells is produced by a process that removes iron from the mix.
Soda-lime glass is a uniform mixture at the molecular level. It is made from soda ash (sodium carbonate, Na2O), limestone (Calcium Oxide, CaO) and silica sand (Silicon Dioxide, SiO2). Silicon Dioxide is the primary ingredient, but it has a very high melting point. Sodium Carbonate is added to the mix to lower the melting point to a more manageable range, and the calcium oxide serves to make the glass less susceptible to weathering.
The glass used to manufacture windows is produced by the float glass production process. The uniform mixture of soda ash, limestone and sand is heated and melted. A ribbon of this hot, viscous, liquid glass is extruded and floats on a bed of molten tin.
It is interesting to note that Silicon Dioxide, without the other ingredients, can be melted and formed into glass. This is known as fused Silica. Soda-lime glass does not have the ability to pass light in the far infrared (radiated heat, however, fused silica does. While it is expensive to produce fused silica, due to its high forming temperature, fused silica finds wide use in LASER, thermal imaging, and instrumentation lenses. The low coefficient of expansion and wide temperature range also make fused silica ideal for elevated temperature windows.
As we said, glass is amorphous. That is, the molecules of glass do not form crystals, even when cooled very slowly. Many of the other materials that are classified as glass will form crystals if slowly cooled. To produce glass from these other materials, they must be rapidly chilled.
To form glass into shapes, it must be heated to the glass transition range. This is the temperature range, below the melting point, where permanent elastic deformation can occur. At this elevated temperature, the heated glass can then be bent and formed and when cooled it will retain the new shape. At temperatures below the glass transition range, glass cannot be formed. It will bend and break but not change shape.
Tin and Air Side Properties
The bottom surface of float glass, which contacts the tin, is known as the tin-side. The opposite side is called the air-side. The tin diffuses into the glass surface resulting in the tin-side and air-side having distinctive characteristics which must be considered when processing.
- The tin side has better resistance to staining and weathering..
- The tin side also has a slightly higher reflectance than the air side, but this is normally not detectable.
- The tin side effects on the PVB adhesion: Air side – better adhesion and Tin side – Lower adhesion, more shock absorbing and the possible
- Effects to printing enamel as the Printing/enamel/paint might not adhere/dry properly on to the tin surface-> Check this from your enamel supplier.
- Possible differences between the final enamel color after firing.
- The cutting side is found to have a major influence: specimens cut on the tin side have a considerably lower flexural strength than those cut on the air side. This is due to the fact that cutting on the tin side results in cuts which are much more irregular than is the case for cuts made on the air (Source: Flexural strength determination of glass: comparison of two test methods Stijn De Pauw side.)
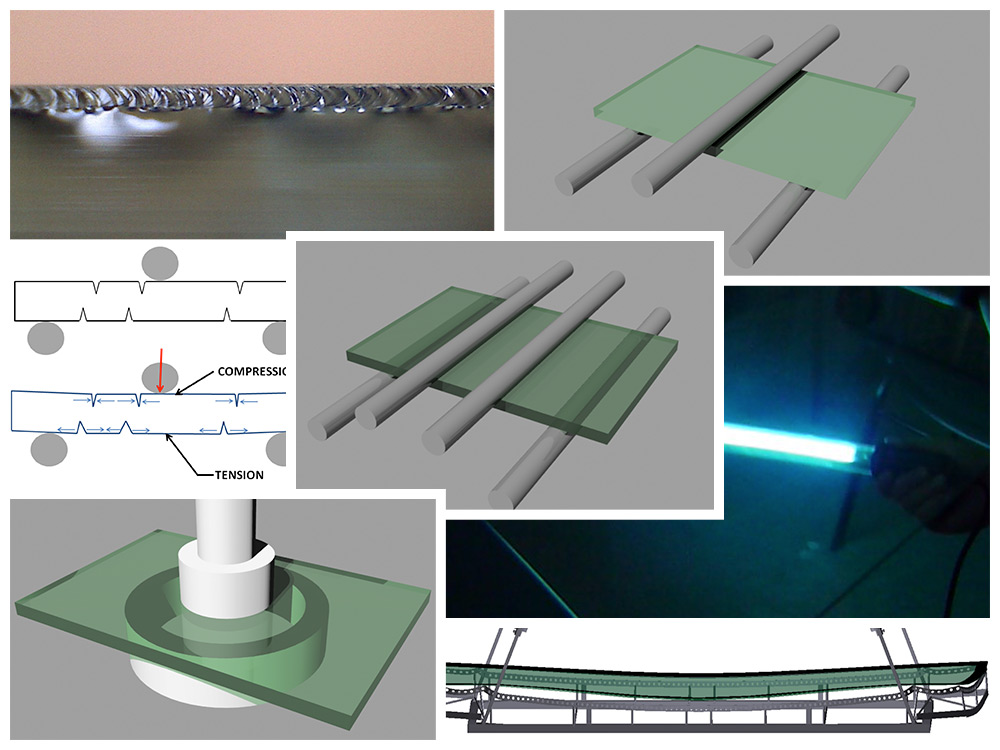
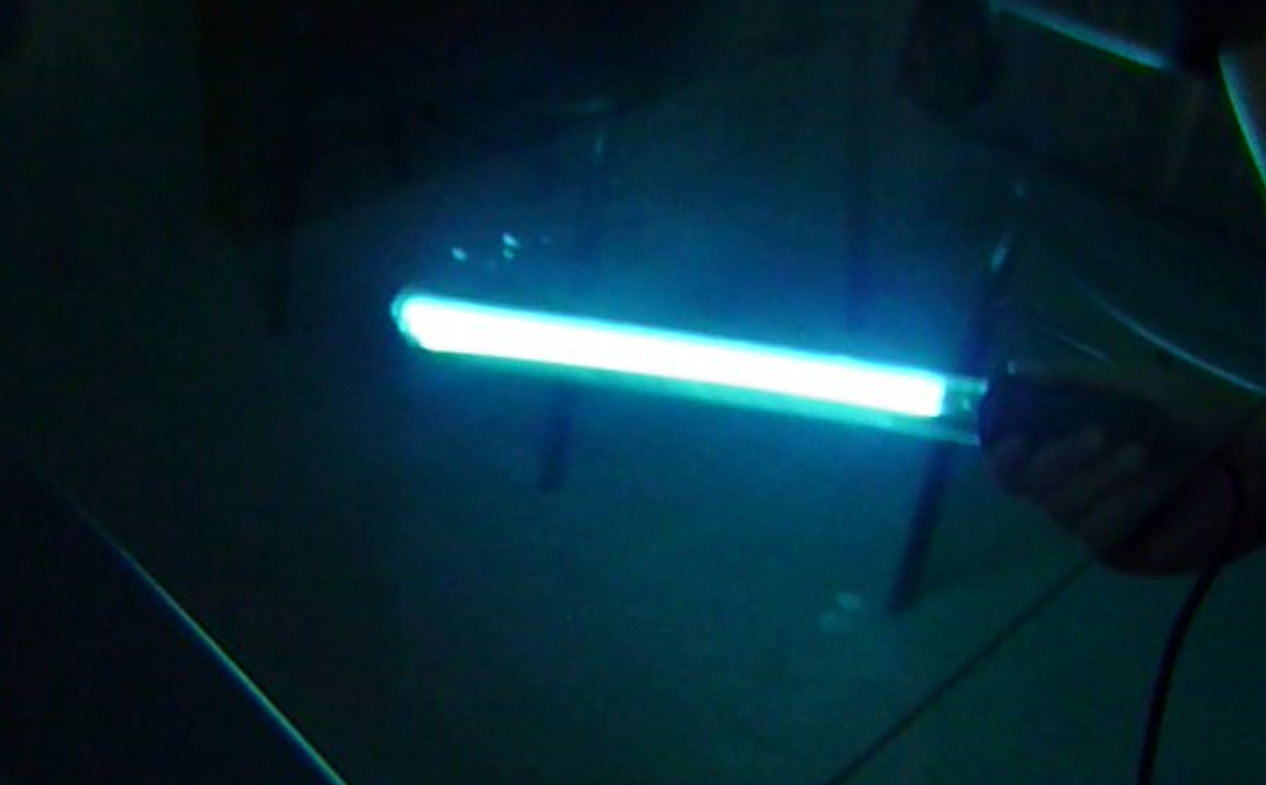
For these and various other reasons it is essential to identify the tin/air side and maintain the decided orientation. It is easy to find the tin side. Raw float glass is almost always packed with the air side facing out and cut on the air side. If you examine the edge, you can see the score marks. Naturally, there are also automatic devices that will identify the tin and air side. Manually the tin side can also be identified by exposing to a UV light in a darkened room. Hold the light source under the glass around 45 º angles to the glass. If the tin side is facing down, you can see the bath or tin side gleams in bluish/white, while the air side of the glass does not have this gleam. Then turn the glass around and repeat to confirm the tin side. Execute random tests occasionally to confirm.
The glass orientation is particularly important with penetration tests to determine the impact side and/onto establish test deviations attributable to differing PVB adhesion to the respective glass side.
The Strength of Glass
Looking at glass at the molecular level, we would expect the strength of glass to be in the 45GPa range. However, we find that the actual strength is orders of magnitude lower than the predicted potential strength. In this section we will examine why this is.
Many materials, such as metals, when subjected to a sufficient load, will undergo a permanent deformation. If the load is increased to a high enough level, they will elongate and then snap. This is how we typically define the tensile strength of a material. Glass, however, is very different. At room temperature, if we lightly flex a flat plate of glass, the glass will bend. If we continue to flex and apply enough force, the glass will eventually break. If we then take the broken pieces and piece them back together, we will note that the original shape has not changed; all of the pieces are as flat as when we started. If the force is removed before it breaks, the glass will return to its original shape. This is what we mean when we say that glass behaves in a nearly perfect linear elastic manner at room temperatures. That is, unless the glass breaks, it will return to its original shape. It does not have a stress region where it will undergo a permanent deformation below the glass transition temperature.
If we take 10 steel rods, from the same batch, and pull test to failure, we will get a nice normal distribution of failure values with low variation. Glass is very different in this respect too. The strength of glass is a continuous random variable which is a function of both duration and load. With brittle materials we find that we cannot specify an absolute yield strength but only a probability of breakage or fracture, Pf , given a specific load and load duration. If we bend several, near identical glass coupons, until they break, we will get a wide range of load values. Annealed glass typically has a coefficient of variation of 0.2. This is ratio of 1:5 of the standard deviation to the mean, indicating an elevated level of scatter in the data. So, if we have a mean of say 1,000, the standard deviation would be 200 with a 99.7% of the values falling between 400 and 1600.
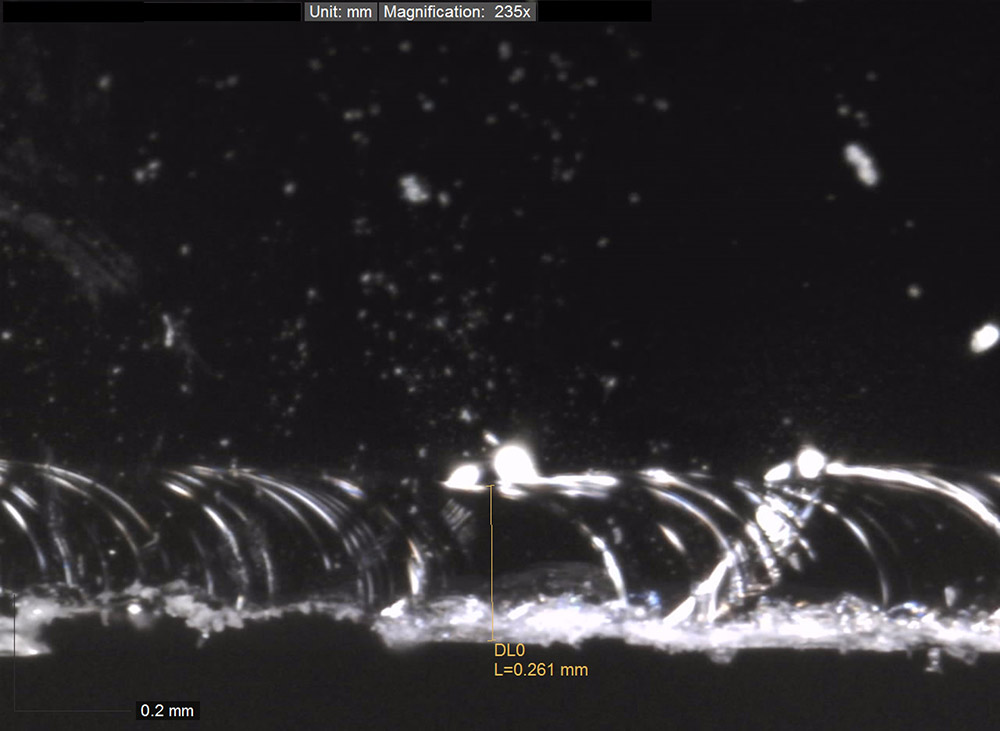
Why is this? The glass produced by the float process appears to be perfect when examined with the naked eye. In fact, during manufacture, the glass is inspected on the float line by machine and any visible defects are detected and discarded. The near visually perfect glass though will still have surface defects at the microscopic level. These come from contact with the float line rollers, cutting, handling, interleaving material, contact with other plates of glass and various other sources. The distribution of these defects on the surface and severity is random and follows a normal distribution.
In addition to mechanical damage, the surface of the glass “weathers” upon exposure to the water and the humidity in the air. The water reacts chemically with the silica in the glass. This weathering effect works make existing surface defects larger and the glass weaker. This is why the theoretical strength is much higher than the actual and explains why glass that has been exposed to the elements for several years is much weaker than the same glass when new.
Slow Crack Growth
Glass has very high compressive strength and almost always fails in tension due to these surface defects. Under compression, this surface defects are forced in the closed direction and cannot open. But, under tension, the surface defects are pulled in the open direction. The surface defects or cracks serve as the weakest link under tension. Due to the near perfect elastic behavior of glass, the defects cannot deform to relieve the stress but instead do the opposite, acting as stress concentrators. Surface defects, most of which are microscopic on new glass, when stressed in the open direction, will grow if the stress is above a certain critical value. This is known as slow crack growth (SCG). This is not a linear function. Crack growth accelerates with tension. Most of us have seen this process at work as a small stone chip on a windshield grows and quickly travels across the glass.
Aging has an effect on slow crack growth. If we take a batch of identical coupons and test half today and the other half a year from now, the coupons evaluated today will have a higher strength. This is also due to slow crack growth. Even when with no applied stress, the glass surface will react chemically with the water in the air expanding the cracks and weakening the glass. In one study, glass that had been aged and exposed to the elements for 20 years only had only 1/7 of the strength that is originally had.
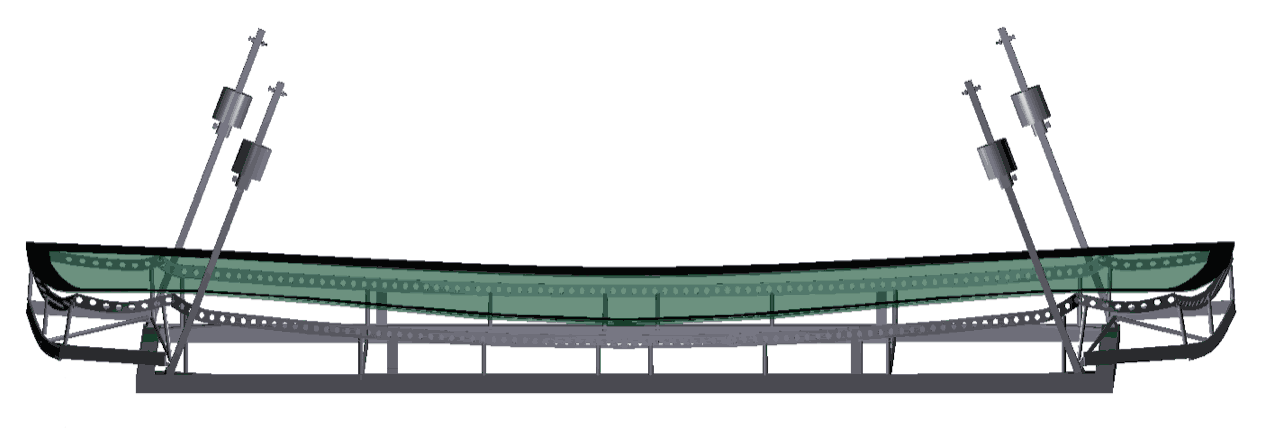
Strength test values are also sensitive to the rate of loading. A 30 second ramp versus a one-hour ramp, we will yield higher strength for the 30 second group. With more time, the surface defects will grow and fail at a lower load. Glass flexure test standards call for a load time of under 30 seconds for satisfactory results. As a practical example, loading larger windshields on top of a mold under conditions where the glass is subjected to point loading the SCG will occur. Although the glass might not break initially on the mold it has higher possibility to break once subjected to heating. These before transition range temperature breakages of the glass are typically called pre-bending breakages. Safety Glass Experts has practical experience about this described phenomenon with heavy commercial vehicle windshield bending.
For an in-depth look at how the slow crack growth rate is determined see: ASTM C1368–10, Standard Test Method for Determination of Slow Crack Growth Parameters of Advanced Ceramics by Constant Stress-Rate Strength Testing at Ambient Temperature.
Healing
“Healing” is another interesting phenomenon. Healing suggests that the cracks are somehow closing and the surfaces are joining back together. That is not the case.
If we take a set of coupons and mount them such that they are under stress and allowed to remain under stress for some period of time, and then evaluate a subset of them, we will find that the strength has decreased from the initial value. This is due to slow crack growth. If we let that same set then sit for a sufficient length of time, we will measure a higher strength value than we initially did. The theory holds that the surface defects, rather than actually healing; react with the water in the air. The chemical reaction blunts or dulls the tips of the defect. When placed under stress again, the direction of the crack has to change slightly to go around the deposit, slowing the growth.
Flexural Strength
Measured strength values are sensitive to how the coupon is supported and loaded. Three distinct types of flexural strength testing of glass are in common use: three-point beam bending, four-point beam bending and the co-axial double ring test.
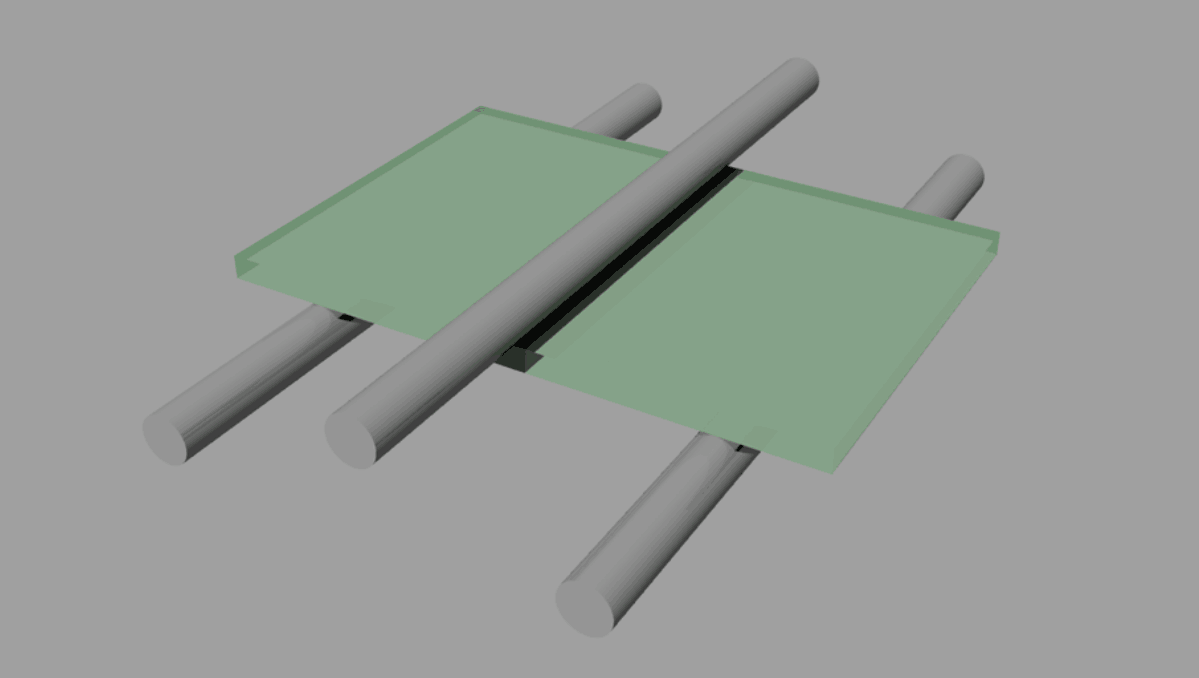
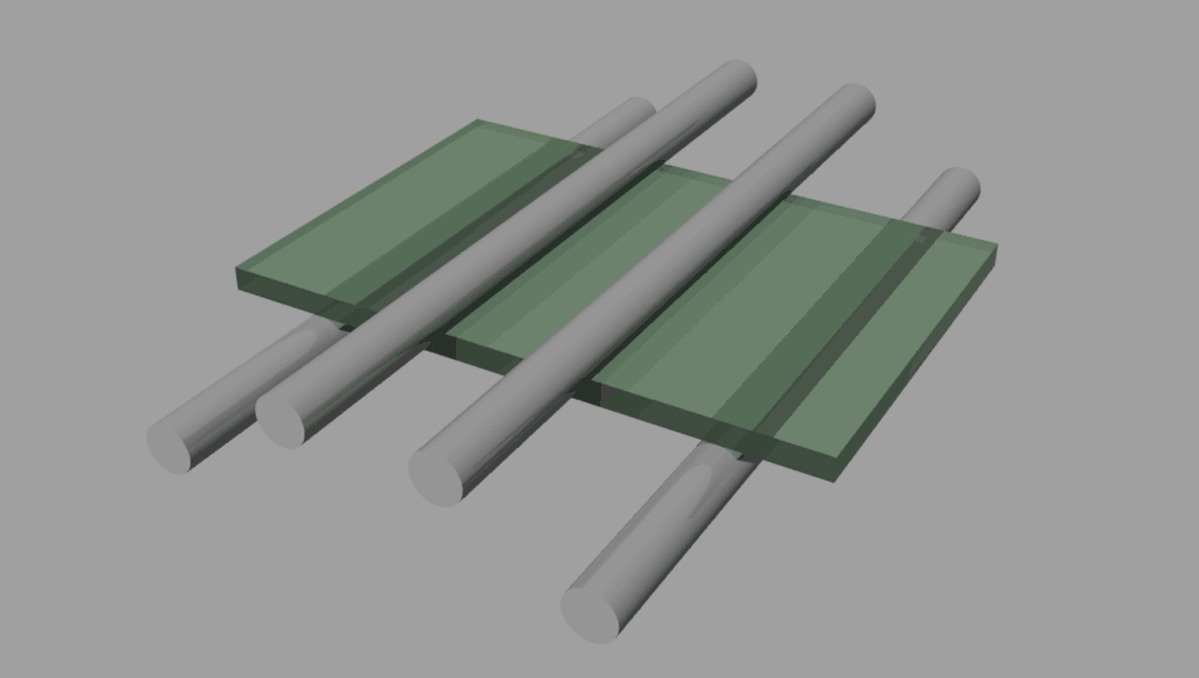
With Three Point Beam Bending, the glass coupon is supported along two lines by cylinders. Loading is applied by a single cylinder applying pressure at the center.
Four Point Beam Bending supports the coupon along two lines, as with three point, but applies the load using two cylinders.
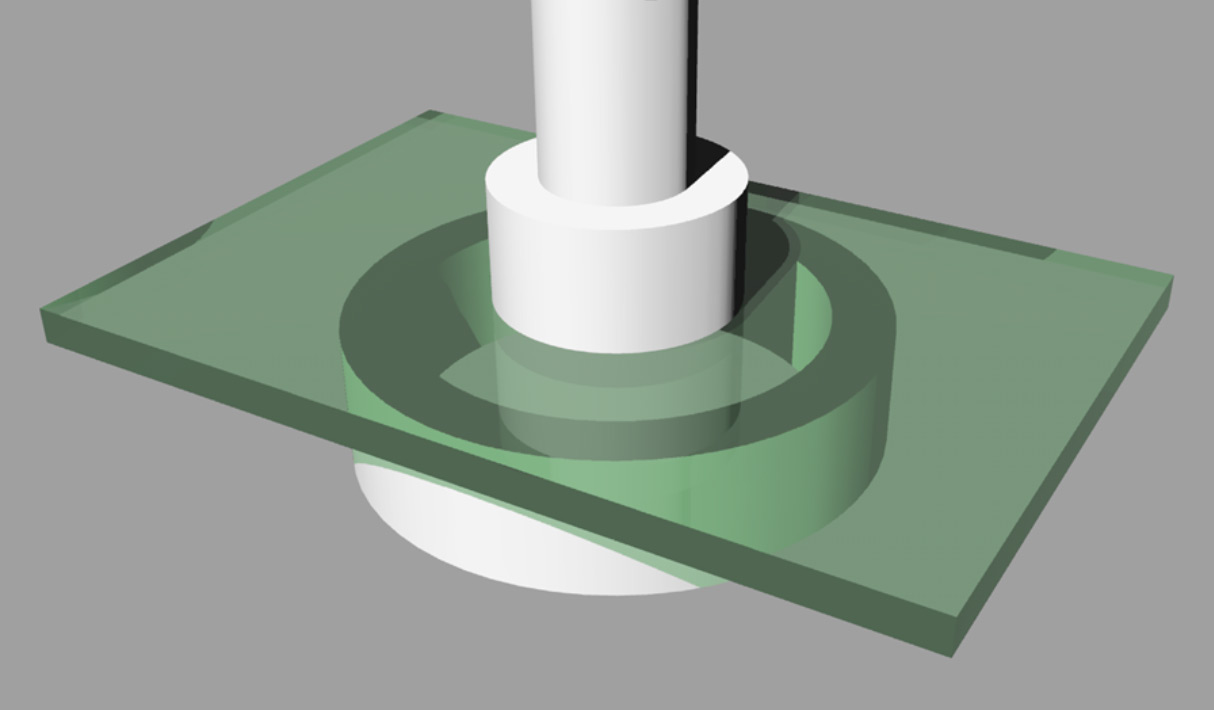
The Coaxial Double Ring supports the coupon on a larger outer ring while the load is applied by a smaller inner ring.
For a set of identical test coupons, the three methods will give different results, due to the different loading and support used by each. The three point bending method tends to give much higher strength that the four point method. This is because with the three-point fixture, a smaller area of the glass is subjected to the maximum tension. This places a lower number of surface defects under maximum stress. The four point bending fixture, on the other hand, places the larger area, between the two load cylinders, under maximum stress making it more likely to fail at a lower level due to the substantial number of defect that see the maximum stress level.
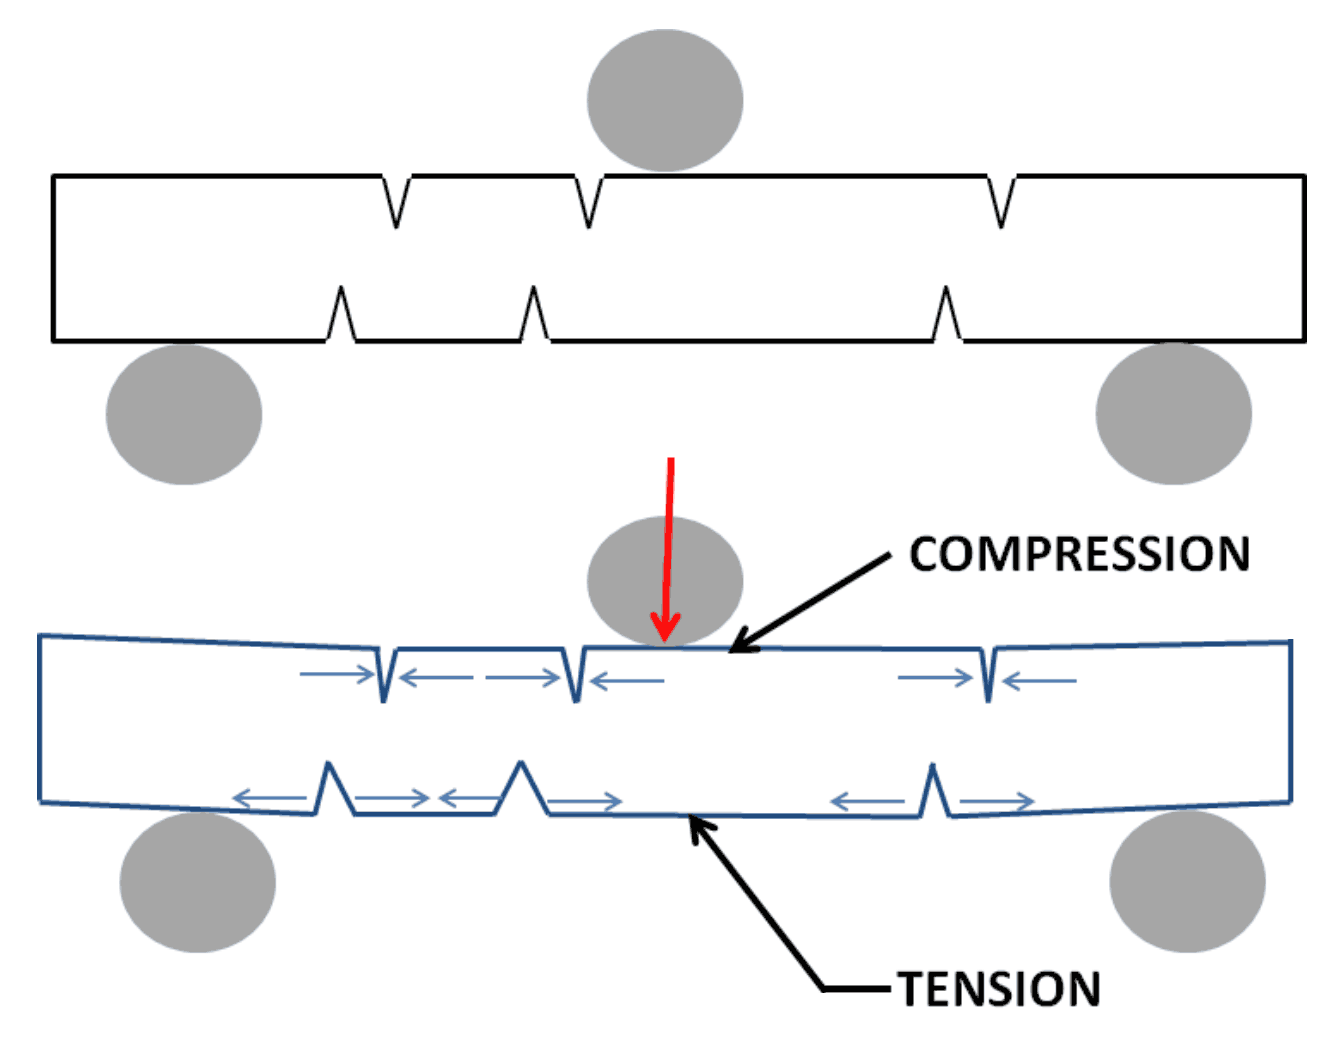
With both the three- and four-point bending test it is important to have good edge work on the coupons as the edges are placed under the same level of stress as the surface. Transparent tape should be placed on the compression side, to hold the fragments together so that the fracture origin can be identified. Fractures that originate due to surface defects will have a different distribution than those that originate along the edges.
The coaxial double ring minimizes the effect of edge breakage. The coaxial test places an area inside of the outer ring under stress, but places little stress at the edges. As the edges generally have a higher level of defects than the surface, the edge is where fractures tend to start. This test is more appropriate for glass used in building windows as it better simulates wind loading. In flat windows, the center deflects resulting in higher stress at the center. In bent shapes, the center deflection is less, due to the part curvature and the stress is transferred to the edges.
The three types of flexural tests can all be used to compare one type of glass to another provided that the same test method is used for all. While all three methods give similar relative results, we cannot compare the results from the three methods for the reasons cited. This variation makes it difficult to use the data in determining design parameters.
Weibull Analysis
The data derived using all three of the test methods described can be used to find the probability of breakage, given a load and duration by using Weibull analysis. The Weibull distribution is a continuous probability distribution which has found wide application in probability and statistics particularly in reliability and failure analysis. Weibull analysis provides a useful tool to find the probability of glass breakage versus load from test data. The probability of failure, Pf, of a brittle material can be represented by an exponential function with two parameters, β a shape parameter and θ, the scale parameter of the distribution. Glass will always have a value of β that is greater than 1, indicates that the failure rate increases with time. The Weibull plot of the test data should match the theoretical to within five percent and form a straight line. If the deviation is greater than 5%, more than one source of variation may be present (edge fracture, vs. surface fracture). The Weibull parameters for a given data set are best calculated using statistical software.
For a detailed description on how to perform Weibull analysis of glass, and sample computer code, see: ASTM C1239 Standard Practice for Reporting Uniaxial Strength Data and Estimating Weibull Distribution Parameters for Advanced Ceramics.
AUTHORS: Charles S. Voeltzel and Mika Eronen from Global Glass Specialists
© Global Glass Specialists
All graphics, photographs, and text appearing in this article belong to Global Glass Specialsits. Redistribution or commercial use is prohibited without express written permission.


